Binance fees, line by line
Spot tiers, the BNB discount, futures on notional, and the Convert spread that never appears as a fee. Written with the arithmetic on the page so you can work out which of them is actually costing you anything.
Snapshot: what a regular account paid, read off Binance's public fee page on 2026-08-30. Entry-level spot fees on the large exchanges have sat in a band of roughly 0.07%–0.10% per side for years, but the exact figure, the tier thresholds and the discount are the exchange's to change at any time. Every number in this box is a dated reading, not a current quote — the live schedule governs.
- Spot maker, Regular User
- 0.100%
- Spot taker, Regular User
- 0.100%
- Either side, BNB discount applied
- 0.07500%
- A full round trip, both legs
- 0.200% of the traded value
- What the first VIP tier requires
- ≥ 1,000,000 USD of 30-day volume and ≥ 5 BNB
Most arguments about exchange fees are conducted at the wrong scale. People read three forum threads about whether to hold BNB for the 25% discount, then fund the account with a card at a couple of per cent, which costs eighty times more and takes ten seconds. So this piece is ordered by mechanism rather than by importance, and ends by putting the numbers side by side. Fee tables are the exchange's to change, and they do change, so treat every figure here as a dated snapshot and read the live table before you act on it.
What is the difference between a maker fee and a taker fee?
A maker order is one that rests on the order book waiting to be matched, and a taker order is one that matches immediately against something already there; exchanges charge takers more because resting orders are what makes the book usable in the first place.
The order book is a list of unfilled offers: people willing to buy at various prices below the market, people willing to sell at various prices above it. Every one of those resting orders is liquidity that somebody else can trade against. If nobody rested orders, there would be nothing to trade against and no price.
So the exchange splits its pricing. Post an order that sits and waits, and you are supplying liquidity, which gets the cheaper rate. Post an order that immediately consumes something already sitting there, and you are removing liquidity, which gets the more expensive rate. That is the whole logic. It is not a penalty for impatience so much as a payment for the service you either provided or used.
The most common misunderstanding here is worth stating flatly. A limit order is not automatically a maker order. The order type is not what determines the fee. What determines it is whether your order rests or crosses. Place a limit buy at 100 when the best ask is 99.8, and it will fill instantly against that ask at 99.8 and you will pay the taker rate. You used a limit order and you were a taker. If you want a guarantee, the post-only flag exists precisely to cancel an order that would otherwise cross rather than let it take. That distinction, and the ways people trip over it, is worked through in the piece on maker and taker orders.
Put the rule in the form you can carry around: a limit order is a maker order only if it rests on the book without matching. Place a limit buy at or above the best ask and it executes immediately against orders already sitting there, at the taker rate, exactly as a market order would. The order type does not decide the fee. Whether the order sits or crosses does.
There is a second cost sitting alongside the fee that the maker and taker labels partly describe. A taker crosses the spread as well as paying the taker rate, so the true cost of taking is the rate plus roughly half the bid-ask gap. A maker who rests and gets filled collects that half-spread instead of paying it. On a tight major pair the gap might be a hundredth of a per cent and the point is academic. On a thin pair it can be several times the fee itself, at which point the resting order is the better trade for reasons that have nothing to do with the schedule.
Now the honest part, which fee comparison articles tend to skip: at the entry level on Binance, as checked on 2026-08-30, the maker and taker rates were identical at 0.100%. The maker and taker distinction pays you nothing at all until you are into VIP territory. Below that threshold, choosing a limit order over a market order is worth doing for execution reasons, because it controls the price you get and stops the order walking the book. It is not worth doing for the fee, because there is no fee difference to collect.
What are the current spot fee tiers?
Checked on 2026-08-30, a Regular User account paid 0.100% on both sides, VIP 1 dropped the maker side to 0.090%, VIP 2 to 0.080%, and VIP 3 reached 0.040% maker and 0.060% taker, with the BNB discount taking 25% off each of those figures.
The table below is a transcription of what was on Binance's public trading fee schedule on that date. The screenshot beside it is the same page as captured.
| Level | 30d volume | BNB held | Maker | Taker | Maker, BNB | Taker, BNB |
|---|---|---|---|---|---|---|
| Regular User | < 1,000,000 USD | ≥ 0 BNB | 0.100% | 0.100% | 0.07500% | 0.07500% |
| VIP 1 | ≥ 1,000,000 USD | ≥ 5 BNB | 0.090% | 0.100% | 0.06750% | 0.07500% |
| VIP 2 | ≥ 5,000,000 USD | ≥ 25 BNB | 0.080% | 0.100% | 0.06000% | 0.07500% |
| VIP 3 | ≥ 20,000,000 USD | ≥ 100 BNB | 0.040% | 0.060% | 0.03000% | 0.04500% |
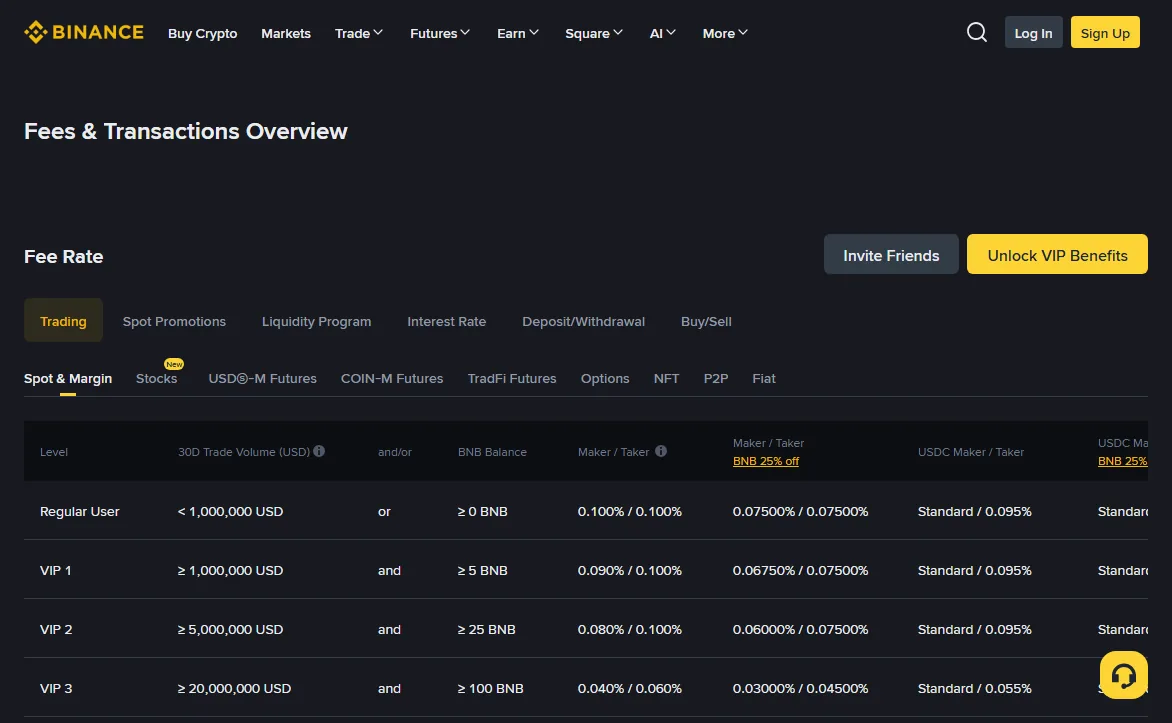
Two details from that page are easy to miss and both matter.
The taker rate barely moves for a long time. Going from Regular User to VIP 2 leaves the taker side untouched at 0.100% while the maker side falls by a fifth. Everything you gain in the lower tiers is on orders that rest. If you trade by hitting the market, climbing tiers does nothing for you until VIP 3.
And USDC pairs showed a separate, lower schedule of their own. If two pairs would both get you where you are going, the quote asset can be worth more than the tier. That is a genuinely useful thing to check for the size of account that will never see VIP 1.
The entry-level row is the one almost everyone reading this is on, so it is worth stating on its own. On 2026-08-30, a Regular User account with less than 1,000,000 USD of 30-day volume paid 0.100% maker and 0.100% taker, or 0.07500% on both sides with the BNB discount applied. Those four numbers are the whole of your fee schedule unless something unusual is true about you. And they are set by the exchange and they change, so read the live table before relying on them rather than on this page.
Volume and BNB are an and, not an or
Both conditions have to hold at once: VIP 1 required at least 1,000,000 USD of 30-day volume and a balance of at least 5 BNB, so hitting the volume with no BNB leaves you on the entry-level schedule.
This is an "and", not an "or", and reading it as an "or" is the standard mistake. Someone who genuinely turns over a million dollars in a month but holds no BNB stays exactly where they started. The BNB requirement is a holding requirement rather than a spending one, checked against your balance.
The volume side is measured over a rolling window rather than a calendar month, and the exchange defines what counts toward it. Spot and futures are tracked on their own schedules. Do not assume that activity in one product lifts your tier in the other; read the definition on the fee page rather than reasoning it out.
It is worth sitting with the size of that first threshold for a moment, because it reframes the entire tier discussion for most readers. One million dollars of 30-day volume means roughly 33,000 USD of trading every single day for a month. Volume counts both sides, so a position opened and closed contributes twice, which helps, but not by an order of magnitude. An account with a few thousand dollars in it would have to cycle its entire balance several times a day, every day, to get there.
The practical conclusion is unglamorous. If you are reading this to work out how to reach VIP 1, you are almost certainly on the Regular User row and will stay there. That is not a problem. It just means the tier table is the wrong place to be looking for savings, and the sections below are the right ones.
One more thing about the mechanics of the tier itself. Tier assignment is recalculated by the exchange on its own schedule rather than the instant you cross a threshold, and it can fall as well as rise. A month of heavy trading followed by a quiet one will move you back down when the rolling window catches up. Nobody sends you a notice about that. The place to confirm which tier is currently applied to you is the fee information page inside your own account, not the public table, because the public table tells you the rules and your account tells you the outcome.
The pair you trade can matter more than the tier
For most people it matters more than the tier does: the schedule is per market family rather than per account, and on 2026-08-30 the USDC pairs carried their own separate and lower schedule alongside the general one shown above.
The table everyone quotes is one schedule among several. Exchanges routinely run different rates for different quote assets, and they run temporary promotions that make specific pairs cheaper or free for a period. Which means the same underlying trade, expressed through a different quote asset, can carry a different fee without you changing anything about your account.
Before rearranging your holdings around that, do the arithmetic, because it usually does not survive contact with it.
Say a lower schedule saves you 0.02 percentage points on a 1,000 USD trade. That is 0.20 USD. To use it you have to be holding the right quote asset, and if you have to convert into it first, that conversion has its own cost. A stablecoin swap priced 0.05% away from par costs 0.50 USD on the same 1,000. You have spent fifty cents to save twenty. The saving only exists if you are already sitting in that quote asset, or if you are going to trade in it repeatedly enough that one conversion is amortised across many trades.
Liquidity matters more than the schedule anyway. A pair with a lower posted fee and a wider book will cost you more in crossed spread than it saves in fee, and the spread does not appear on any fee page. If a pair's book is thin, the posted rate is the least interesting thing about it. That failure mode is set out in the piece on why a market order fills worse than the price you saw.
The usable version of this: check the fee page for which quote assets have their own row, note whether any pair you actually trade is on a cheaper one, and change your working currency only if you will be trading in it regularly. Otherwise leave it alone.
How much is the BNB discount actually worth?
On the 2026-08-30 schedule the discount was 25% off the spot fee, which at the entry level took 0.100% down to 0.07500%, a saving of 0.025 percentage points or 25 cents per 1,000 USD of turnover.
The framing is what does the damage here. "25% off" sounds enormous. It is 25% of a number that was already a tenth of one per cent, and a quarter of a tenth of a per cent is a fortieth of a per cent. People hear the headline as though a quarter of the trade were coming back.
Here is the saving at realistic monthly turnover. Turnover means the total value traded, so a buy followed by a sell of the same 500 USD is 1,000 USD of turnover.
| Monthly turnover | Fee at 0.100% | Fee at 0.07500% | Saved per month | Saved per year |
|---|---|---|---|---|
| 1,000 USD | 1.00 | 0.75 | 0.25 | 3.00 |
| 3,000 USD | 3.00 | 2.25 | 0.75 | 9.00 |
| 10,000 USD | 10.00 | 7.50 | 2.50 | 30.00 |
| 50,000 USD | 50.00 | 37.50 | 12.50 | 150.00 |
| 200,000 USD | 200.00 | 150.00 | 50.00 | 600.00 |
Take the third row as the realistic middle case for an active small account. Ten thousand dollars of turnover a month is a lot of trading on a four-figure balance, and the discount returns 2.50 USD. Over a year, 30 USD. That is the prize.
The version of that to carry away is a rate rather than a row. A saving of 0.025 percentage points is 25 cents per 1,000 USD of turnover. Multiply by however much you actually trade. At 3,000 USD a month it comes to about 9 USD a year, which is the number I wish someone had put in front of me before I spent most of a weekend reading about tiers. Optimising the fee schedule felt like the responsible thing to do. It was the smallest line on my own statement, and the on-ramp above it was the largest.
Now the part that most write-ups leave out. To hold the discount you have to hold BNB, and holding BNB is a position, not a coupon.
Suppose you keep 200 USD of BNB in the account so the fee deduction never runs dry. At 3,000 USD of monthly turnover you are saving 9 USD a year on a 200 USD holding, which is a 4.5% annual return on that money if the price stands still. It will not stand still. BNB is a volatile asset, and a 20% move against you erases more than four years of savings in an afternoon. A 20% move in your favour is worth more than four years of savings. Either way, the fee discount has stopped being the thing determining your outcome.
Two mechanical details on top of that. The BNB balance is consumed as it pays fees, so it drains and needs topping up, and each top-up is another purchase with its own cost. And if the balance hits zero the discount silently stops applying and you go back to the standard rate without anything alerting you.
If you already hold BNB because you want to hold BNB, switching the discount on is an incremental saving on fees you were paying anyway, and there is little reason not to. If you would be buying BNB purely to save 0.025% on trades, you are taking on price exposure that is one to two orders of magnitude larger than the saving. Those are different decisions and they deserve different answers.
Two legs, two fees, and the move you need to break even
At the snapshot rate of 0.100% per side, buying and selling the same position costs 0.200% of the traded value, so the price has to move about two tenths of a per cent in your favour before you are level, before any spread is counted.
Fees are charged on both legs, and people consistently budget for one. On 1,000 USD that round trip is 2.00 USD, or 1.50 USD with the BNB discount. Then add the cost of crossing the bid-ask spread, which on a deep major pair is small and on a thin one is not.
The number that actually determines what fees cost you is not the rate, it is how often you trade. Consider an account holding 1,000 USD that fully cycles its balance twenty times in a month. That is 40,000 USD of turnover, 40 USD in fees, and four per cent of the account gone in a month before any market outcome. The same account cycling twice a month pays 4 USD.
So the fee tier is a multiplier on a decision you already made about frequency, and the decision about frequency is many times larger than the tier. A trader who halves their number of trades saves more than the entire journey from Regular User to VIP 3 would give them. The trading fee calculator makes this concrete: it shows the round trip in money and the move needed to cover it, and it shows its arithmetic.
Futures fees are charged on notional, not on your margin
Futures fees are computed on the notional value of the position rather than on the margin you posted, so leverage multiplies them: at 10x, a fee quoted on 10,000 USD of notional is being paid out of 1,000 USD of your own money.
Notional value is the full face value of the contracts you control, as distinct from the collateral behind them. Investopedia has a short definition if the term is unfamiliar. Every futures fee is computed against that face value.
Futures rates are published on a separate schedule from spot, on Binance's futures fee page, and they are lower in percentage terms than the spot rates above. That is the sleight of hand. The percentage is smaller and the amount is bigger, because the base it is applied to is your position rather than your capital.
The arithmetic, with a round taker rate of 0.05% used purely to make the table readable. Read the live futures schedule for the current figure and substitute it; the shape of the result does not change.
| Leverage | Notional on 1,000 USD margin | Round-trip fee at 0.05% a side | As a share of your margin |
|---|---|---|---|
| 1x | 1,000 USD | 1.00 USD | 0.10% |
| 3x | 3,000 USD | 3.00 USD | 0.30% |
| 5x | 5,000 USD | 5.00 USD | 0.50% |
| 10x | 10,000 USD | 10.00 USD | 1.00% |
| 20x | 20,000 USD | 20.00 USD | 2.00% |
| 50x | 50,000 USD | 50.00 USD | 5.00% |
Read the 10x row slowly, because it is the one that answers the question people arrive with. A futures fee looks larger than a spot fee on the same account because 1,000 USD of margin at 10x controls 10,000 USD of notional, and the fee is calculated on the 10,000. The percentage on the futures schedule is smaller than the spot one. The amount you hand over, measured against your own capital, is larger. Both of those are true at once and that is the whole of the confusion.
At 50x, opening and closing once has cost five per cent of your collateral. Do that four times in a week and a fifth of the account is gone with the market having done nothing at all. This is the mechanism behind a lot of accounts that bleed out without ever being liquidated.
One clarification, because this table gets misread as an argument against leverage in general. The fee is a function of notional, not of leverage as such. If you take a 10,000 USD position with 10,000 USD of margin, you pay the same fee as taking a 10,000 USD position with 1,000 USD of margin. What leverage changes is the ratio between the fee and your own capital, and therefore how much of your account a round trip consumes. Two people can pay an identical fee while one of them has spent 0.1% of their money and the other 1%.
The maker and taker split applies on futures too, and the gap between the two sides is usually proportionally wider there than on spot. If you are holding positions for more than a few minutes, resting the entry rather than hitting the market is worth more on futures than the equivalent habit is worth on the spot book. Fees are also not the only charge on a perpetual position: funding is settled periodically and is likewise calculated on notional, which is covered in what it costs to hold a perpetual overnight, and a forced close carries its own liquidation charge on top of the loss. The trading fee is the smallest of the three at high leverage.
Is Convert cheaper than placing an order on the book?
Usually not, because Convert and instant-buy paths display no fee line at all and instead price their cost into the quote you are shown, and that built-in margin is commonly several times the 0.100% you would pay trading the same pair on the order book.
"Zero fees" on these screens is technically accurate and practically misleading. There is no fee, and there is a price, and the price is not the mid-market price. The gap is the cost. The bid-ask spread is the underlying concept; what a conversion product does is quote you a rate somewhere outside that spread and keep the difference.
How to sanity-check a quote in about twenty seconds:
- Note the rate and the amount the conversion screen is offering you.
- Open the spot pair for the same two assets and read the best bid and the best ask.
- Take the midpoint of those two. That is your reference price.
- Divide the difference between the quote and the midpoint by the midpoint, and express it as a percentage.
- Compare that against your own current taker rate on the book — 0.100% in the 2026-08 snapshot above, and whatever the live schedule says today.
On a liquid major pair a conversion quote sitting within a few hundredths of a per cent of the mid is a fair deal and the convenience is worth it. A quote sitting 0.3% or 0.4% away is costing you three or four times the order-book route. On 5,000 USD that is roughly 15 to 20 USD against 5 USD, for a transaction that takes the same amount of time either way.
Do the check once per pair rather than once per trade. Conversion margins are reasonably stable per market, so after two or three measurements you will know which of your regular conversions are fine and which are not.
So: does Convert charge a fee? There is no separate fee line, and the conversion is not free. Those two statements sit together comfortably once you accept that the cost is built into the price rather than itemised beside it. The only way to see it is the comparison above: best bid, best ask, midpoint, and how far the offered rate sits from that midpoint. Anything you cannot measure that way you are taking on trust.
None of which means the product is a trap. Convert is genuinely the right tool in three cases: amounts too small for the order book's minimum trade size, dust balances you are consolidating, and pairs so thin that a resting limit order would never fill. It is also, honestly, the right tool for anyone who is going to mis-key a decimal place on the trading screen. A known 0.3% is better than an accidental extra zero.
The same reasoning applies to any conversion inside a transfer, which is dealt with from the other direction in the transfer cost breakdown.
What does it cost to get money in with a card?
Card and instant fiat purchases sit in a completely different order of magnitude from trading fees, typically in the low single-digit per cent, which is roughly twenty to forty times what the same amount costs to trade on the spot book.
This is the number almost nobody optimises and it is nearly always the largest fee anyone pays. Read the exact figure on the payment screen before confirming, because it varies by country, card scheme, currency and provider, and it is quoted separately from the trading fees discussed above.
The card route also has costs that are not the exchange's at all:
- Currency conversion. If your card is denominated in something other than the currency being charged, the issuer adds its own FX margin on top of the platform's.
- Cash advance treatment. Some issuers classify crypto purchases as cash advances, which can carry a separate charge and can start interest accruing immediately rather than at the end of a statement period.
- The spread inside the quoted price. An instant-buy screen prices the crypto as well as charging a fee, and the same reasoning from the Convert section applies.
Bank transfer rails are usually far cheaper and sometimes free, at the cost of taking a day or more. Peer-to-peer sits in between and has a spread of its own that needs benchmarking against spot, which is what the piece on reading P2P prices is for.
The exit is the same story in reverse and gets even less attention. Taking fiat back out carries its own charge, which varies by rail and country, and a card payout is typically dearer than a bank transfer just as it is on the way in. If you plan to move money in and out more than once, price the round trip rather than the deposit, because two on-ramp charges and two off-ramp charges will comfortably exceed everything you spend on trading in between.
Here is the comparison that makes the point. A 2% card fee on 1,000 USD is 20 USD. At the snapshot rate of 0.100% a side, 20 USD buys you ten full round trips of that same 1,000 USD. One click on a payment screen has cost more than a month of active trading. If you take one thing from this article, that ratio is it.
Check what you actually paid, not what the schedule says
Open your own trade history: every fill carries a fee column showing both the amount charged and the asset it was charged in, and that record is the only authoritative account of what a trade cost you.
Everything above this point is what the schedule says. What you paid is a separate question, and the two come apart more often than you would expect.
On the spot side, the fee is recorded for each fill. An order that filled in six pieces across several price levels produces six fee rows, so an order-level total must add all six. Do that before comparing anything against the posted rate, or the number will look wrong.
Reconcile one order without guessing
Calculate each fill’s commission from its executed quantity, execution price and applicable fee rate, then add the commissions on a consistent currency basis. Binance’s spot-fee support page also makes a useful distinction: the estimate shown before execution is only a reference, while Trade History records the amount actually charged. That gives you a clean way to investigate an order whose cost appears to disagree with the headline rate.
- List every fill belonging to the order. Keep its executed quantity, execution price, maker or taker role, commission amount, and commission asset. Do not use the unfilled part of a partially completed order.
- Rebuild the notional one fill at a time. Multiply executed quantity by execution price, apply that fill's rate, and only then add the results. One order can include fills at different prices and, in edge cases, different liquidity roles.
- Put every commission into one comparison currency. A buy normally pays the fee in the asset received; a sell normally pays it in the quote asset. If BNB deduction was active, the record shows BNB instead. Convert those amounts at the prices applicable around the fills before adding them.
- Keep execution cost separate. The difference between your fill and the market midpoint is slippage or spread, not commission. Funding, borrowing interest and liquidation charges also belong on separate lines.
- Compare the reconstructed rate with the rate that applied then. Use the pair, VIP level, promotion and BNB setting from the trade date. Today's public schedule cannot prove what a historical trade should have cost.
Take a deliberately simple 2,000 USDT spot buy that completes in two fills: 800 USDT and 1,200 USDT. At an illustrative 0.100% rate, the commissions have a combined value of 0.80 + 1.20 = 2.00 USDT. With an eligible 25% BNB reduction, their combined value would instead be 1.50 USDT, paid in BNB. The trade history may therefore show two small BNB amounts, with no single 1.50 USDT line. Convert both BNB entries to USDT on a consistent historical basis and the arithmetic becomes comparable.
If your reconstructed number is still different, check four causes before assuming the platform mischarged the order: an insufficient BNB balance can make the standard fee apply; a zero-fee promotion can apply to one pair but not another; rounding happens at fill level; and a marketable limit order can execute immediately as taker even though its order type says “limit.” Each of those leaves evidence in the fill records. The label on the order ticket alone does not settle the question.
Keep the calculation reproducible.
Save the exported fill rows, state the quote currency used for comparison, and record the price source and timestamp used to value any BNB or base-asset commission. Report two totals: commission only, which can be checked against the schedule, and all-in execution cost, which adds the spread or slippage. A single blended percentage without those notes is hard to audit and easy to misread. The extra detail also lets you compare periods fairly when your mix of pairs, order types or fee assets changes.
The fee asset column is the fastest diagnostic on the whole platform. If the fee was taken in BNB, the discount was active on that trade. If it was taken in the asset you received, it was not, which usually means the BNB balance had run out at that moment. Nothing warns you when that happens. It just quietly stops applying and you carry on paying the standard rate. Checking the fee asset on a recent trade takes ten seconds and answers a question people otherwise argue about in the abstract.
On the futures side, the transaction history separates the charges into distinct entries: commission, funding fee, realised profit and loss, and any charge arising from a forced close. They are separate lines because they are separate mechanisms, and treating a funding payment as a trading fee will give you a badly wrong picture of what your strategy costs.
The exercise worth doing once a quarter is short. Export the trade history for the period, sum the fee column, sum the traded value, and divide one by the other. That gives your real blended rate across everything you actually did.
Then compare it against the entry-level rate on the live schedule — 0.100% when this was checked. If it comes out close, your costs are where the schedule says. If it comes out materially higher, the excess is not coming from the fee schedule at all. It is coming from crossed spreads, from Convert, or from an on-ramp, and the number tells you where to go looking.
Which of these fees actually matters on a small account?
The on-ramp and the withdrawal, in that order, and not the tenth of a per cent that most of the discussion is about.
Take a plausible year for a small account. Someone funds it with 1,000 USD, trades a fair amount without being reckless, turns over 6,000 USD in total, and withdraws three times. Nothing exotic.
| Cost | Amount | Share of the total |
|---|---|---|
| Card on-ramp on 1,000 USD at about 2% | 20.00 USD | 69% |
| Spot fees on 6,000 USD of turnover at 0.100% | 6.00 USD | 21% |
| Three withdrawals on a low-fee network | 3.00 USD | 10% |
| Total | 29.00 USD | 100% |
| What the BNB discount would have saved | 1.50 USD | 5% |
Two thirds of the year's costs went through one payment screen in a few seconds. The thing that generates the most discussion, the BNB discount, is worth 1.50 USD and is the smallest line on the page.
So, in descending order of what it is worth doing something about:
- Fund through a bank rail rather than a card where your country and bank allow it. This is worth more than everything else combined, and it costs you a day of waiting.
- Withdraw less often and in larger amounts. The flat withdrawal fee does not scale with size, so consolidating five sends into one cuts that line by around 80%. The arithmetic is in the minimum viable transfer size section.
- Stop paying a spread you did not need to. Check your regular conversions once against the order book. If one of them is 0.3% away from the mid, that single change may be worth more than any tier you will ever reach.
- Trade less often. Frequency is the multiplier on every trading fee you pay.
- Only then think about BNB, and only if you were going to hold it anyway.
The trading fee is real, and at some account size it becomes the dominant term. That size is a long way above where most people are when they start reading about fees. Somewhere in the region of a few hundred thousand dollars of annual turnover the percentages begin to outweigh the flat costs, and at that point the tier table becomes worth optimising. Until then it is the least important number on the screen.
Percentages punish size. Flat fees punish frequency. Work out which of the two you are actually doing, and optimise that one.